
~PrintNoser~
The following is a complete fourier regression analysis of our dataset, for reference. The green lines represent regressions which classify as successes, and the red lines represent regressions which classify as failures.
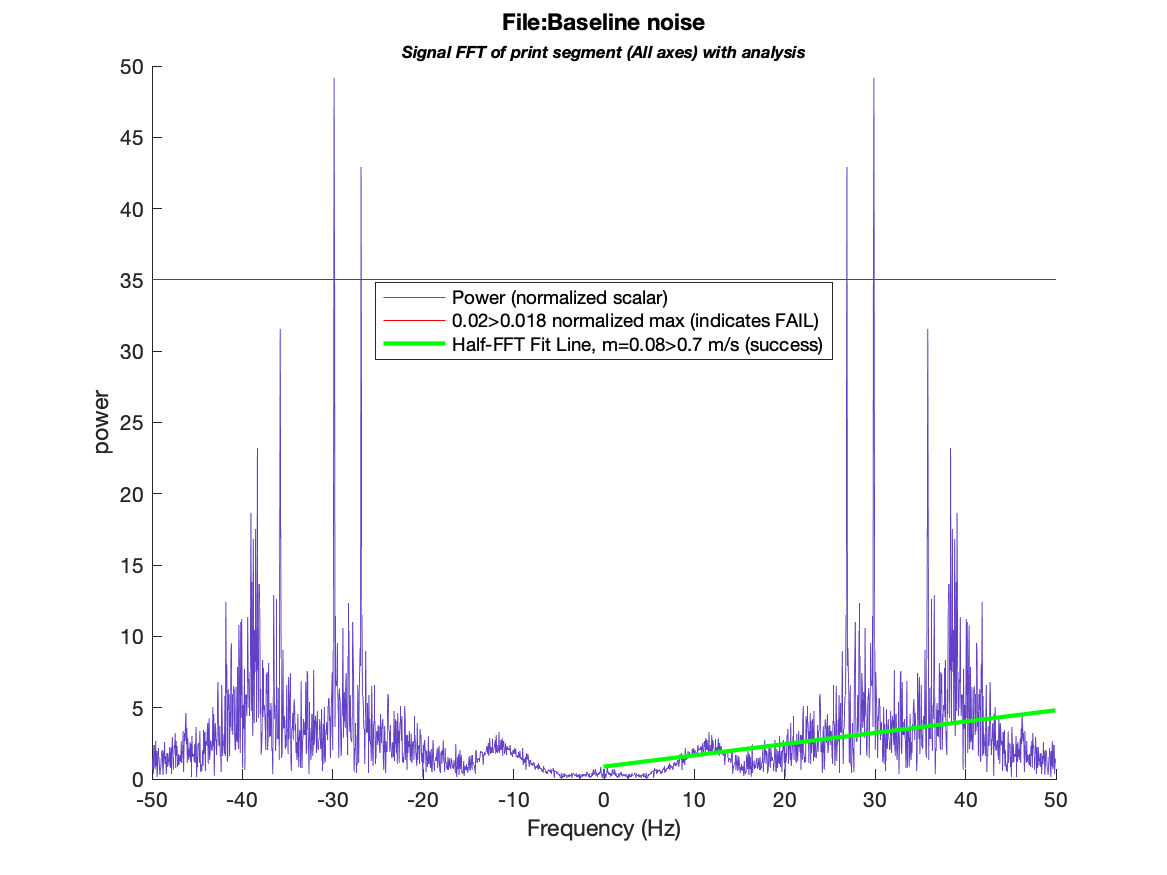
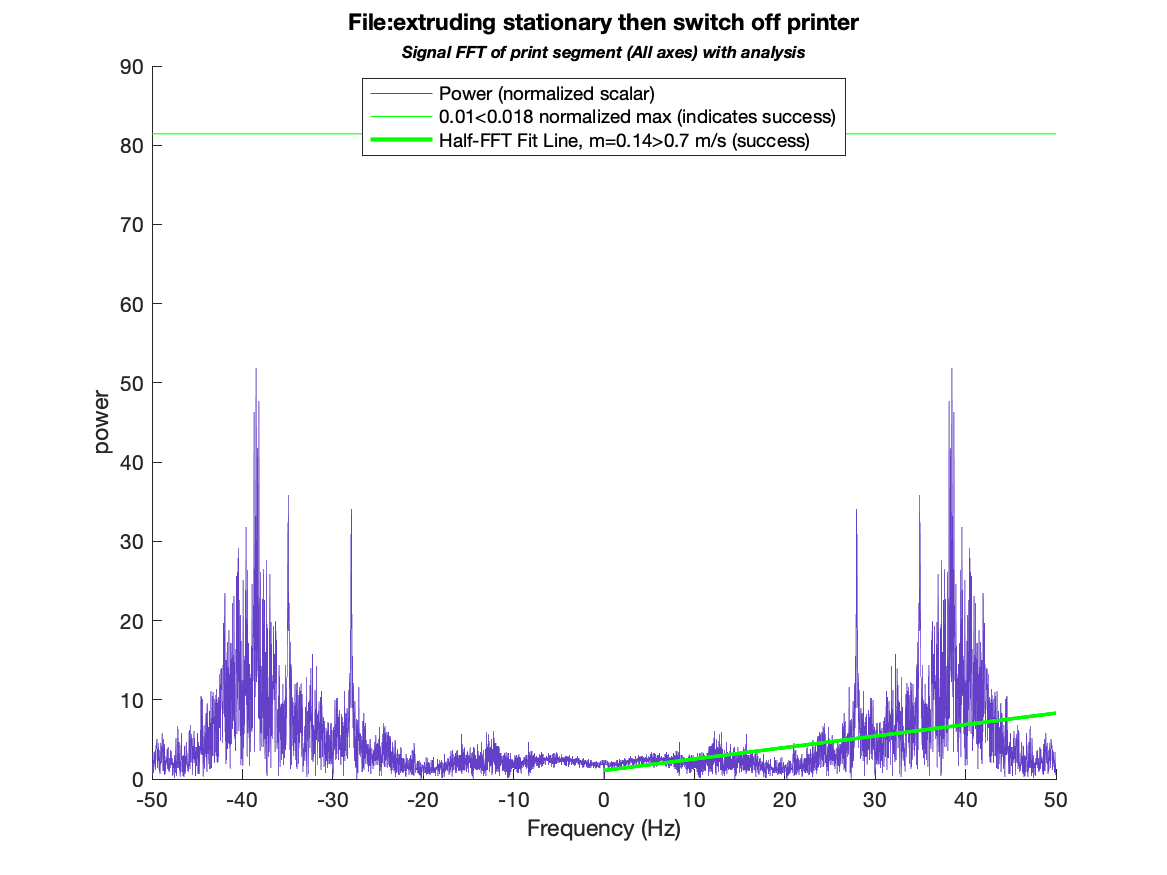
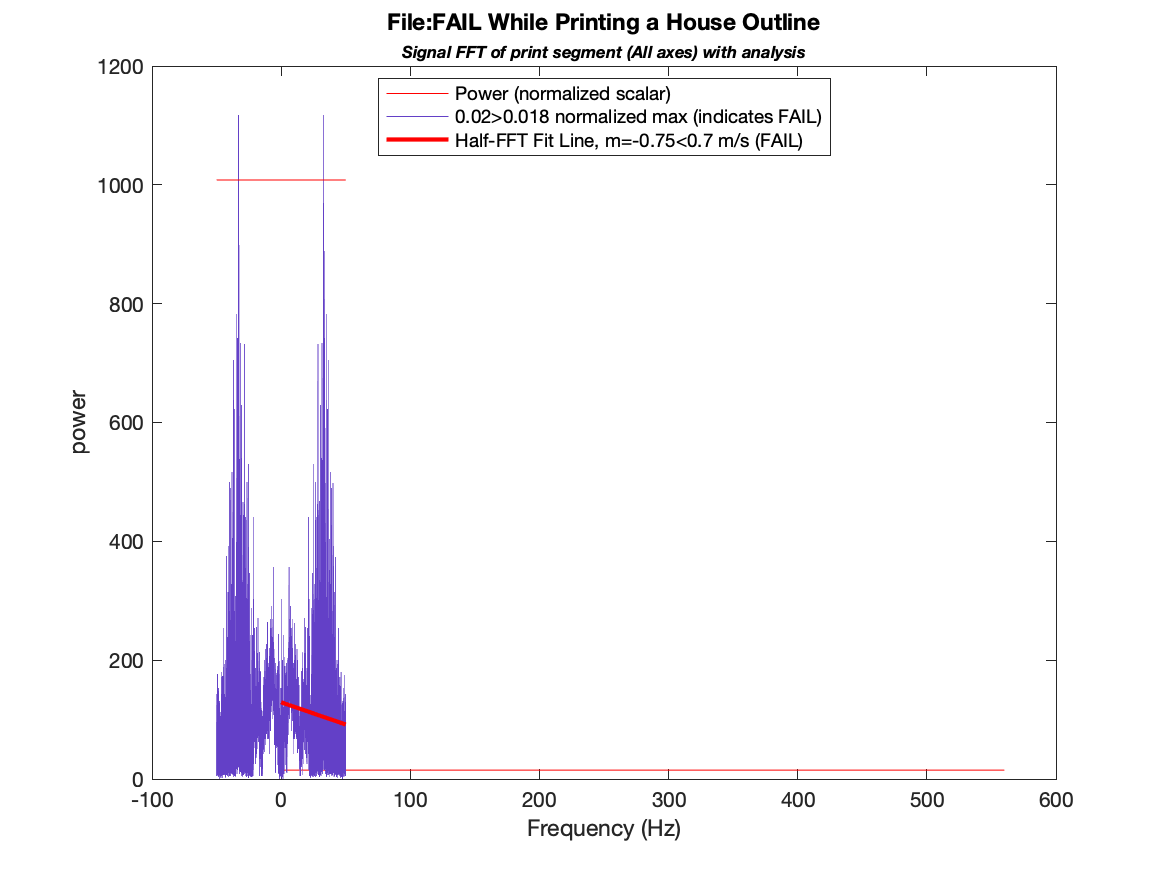
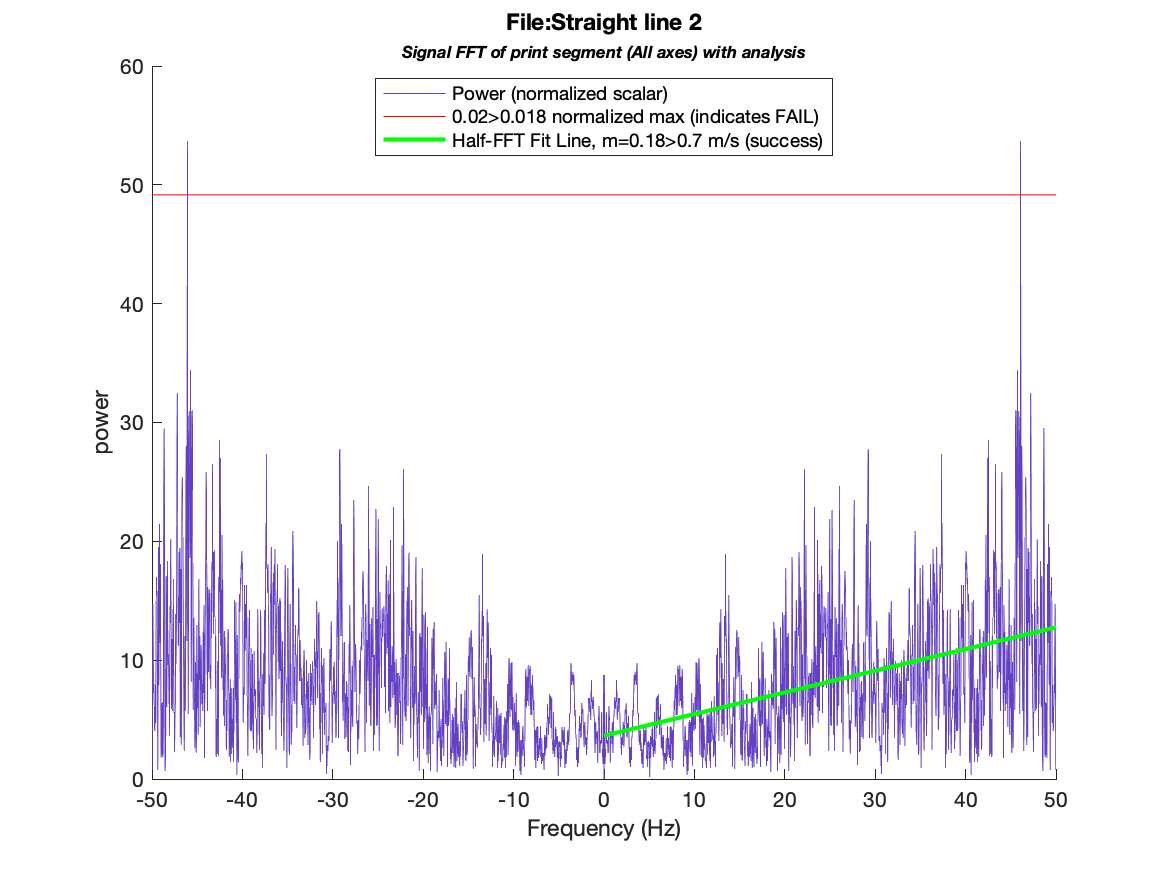
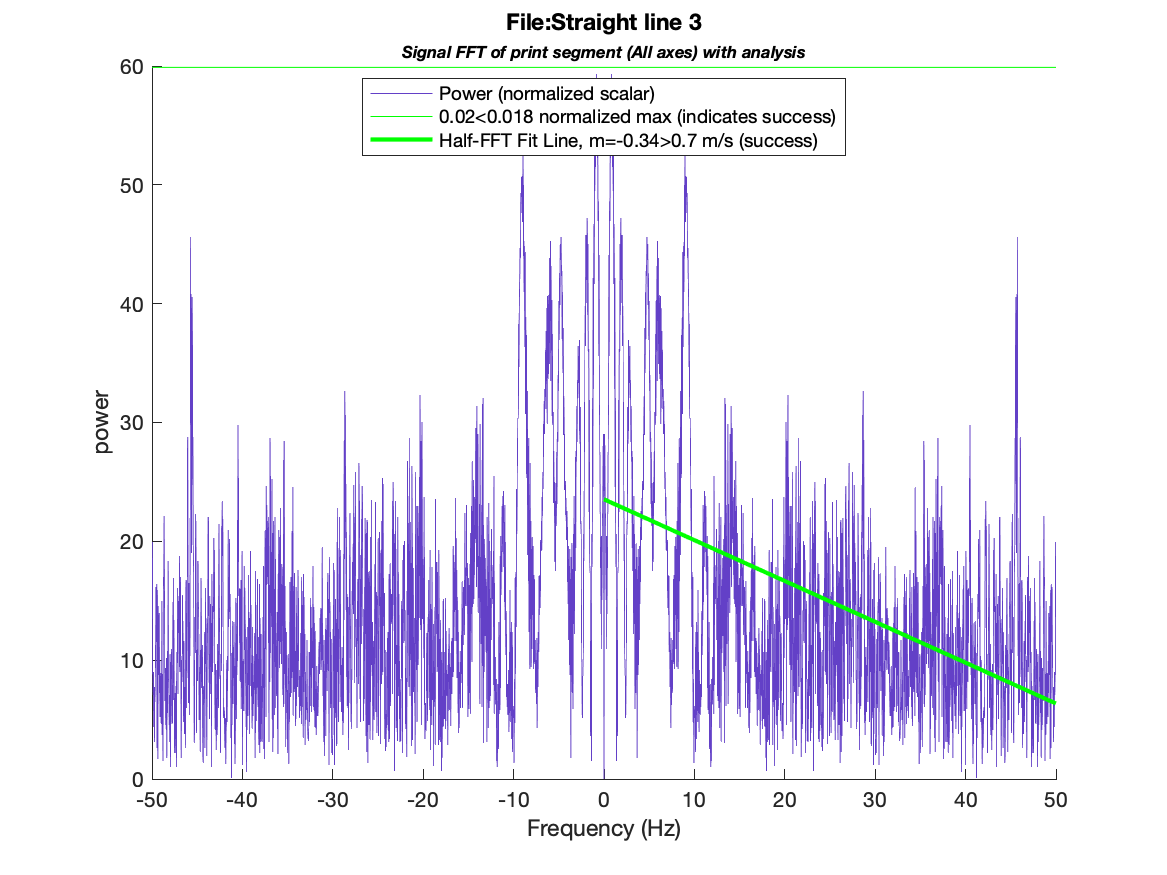
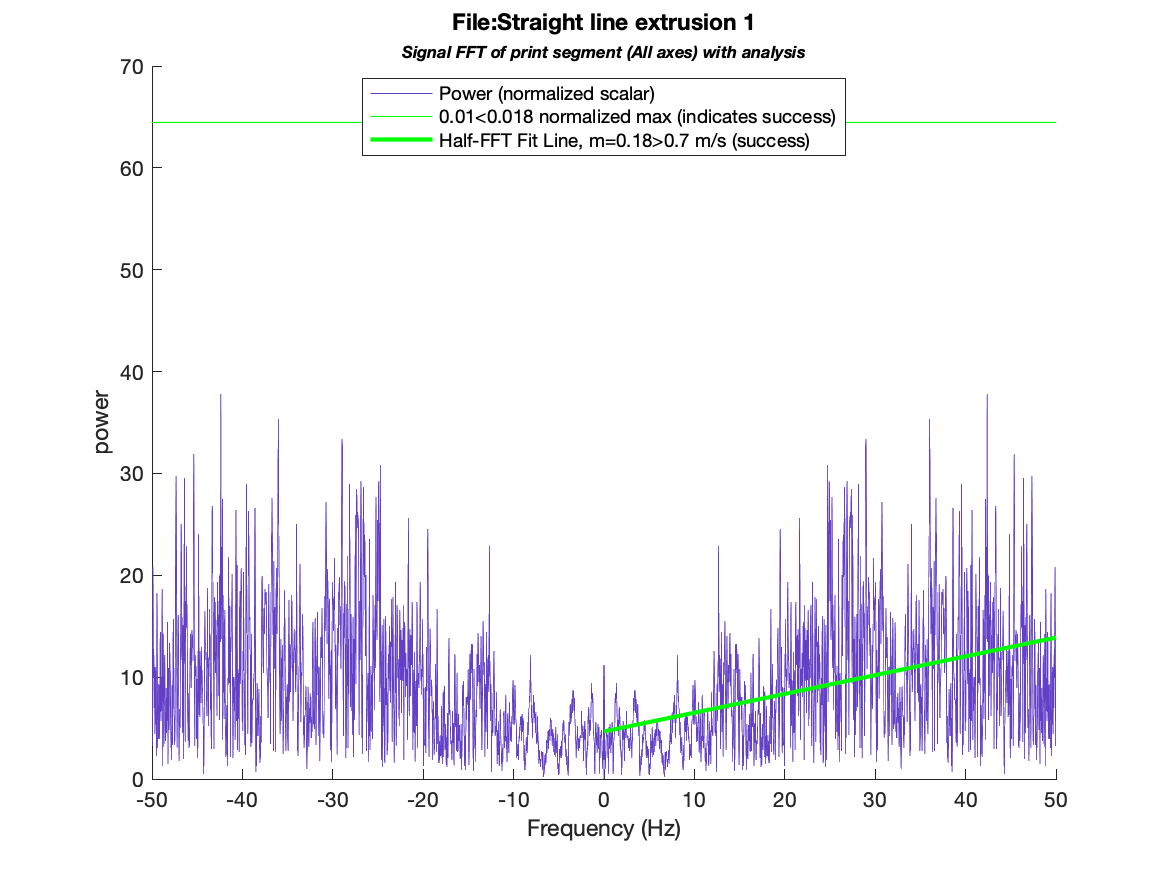
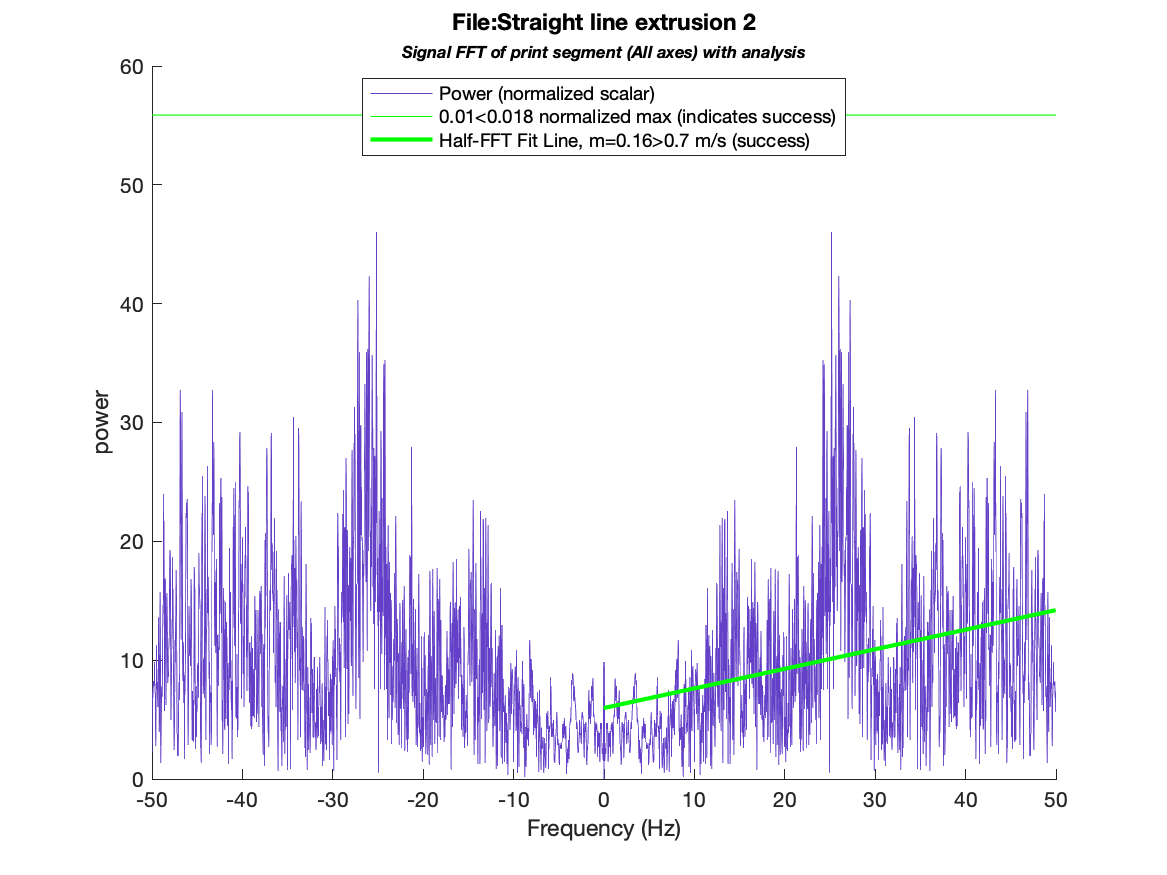
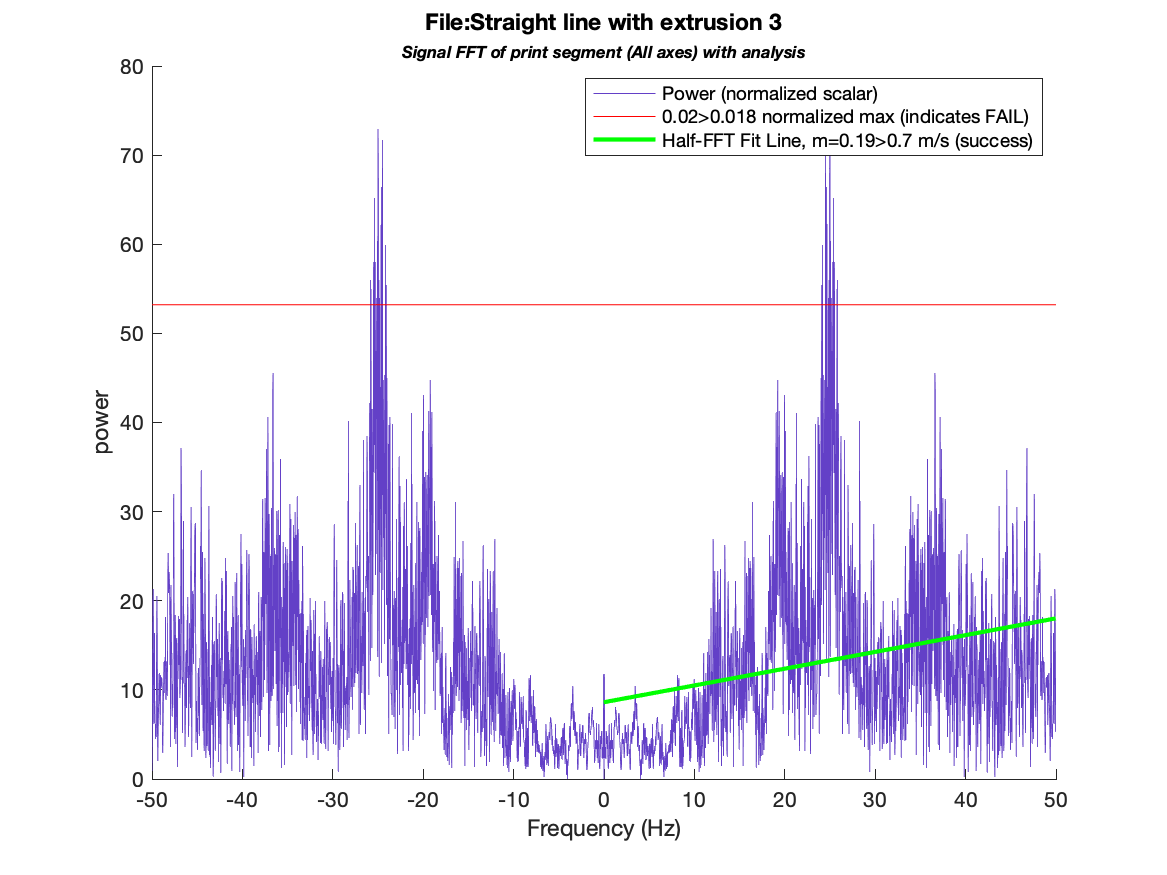

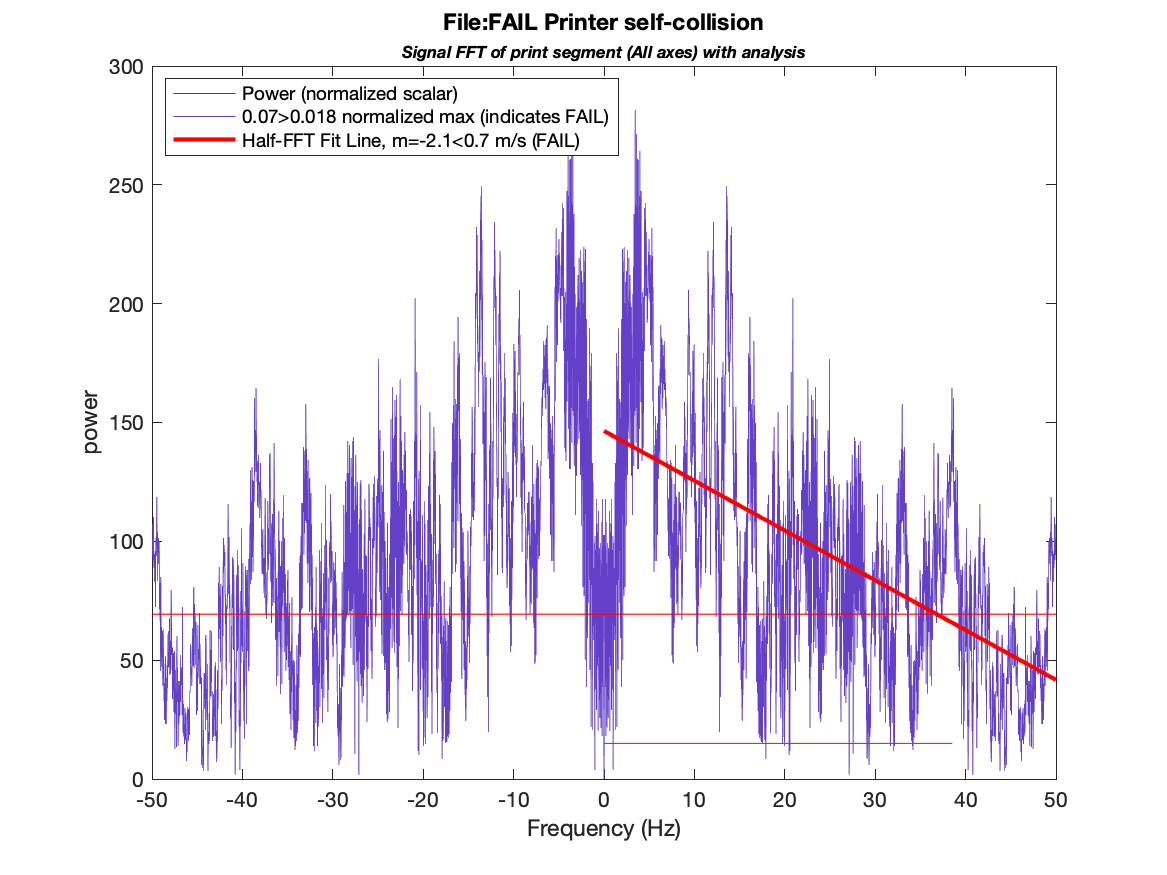
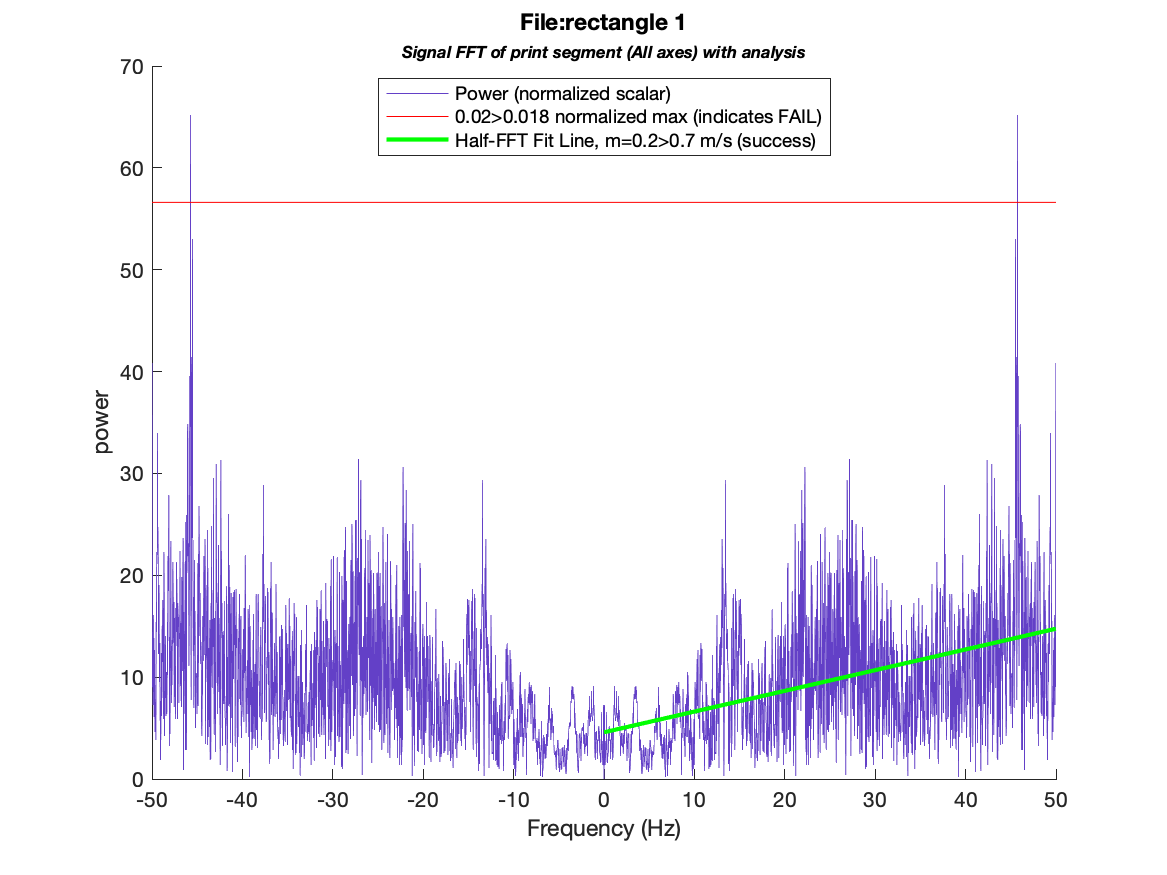
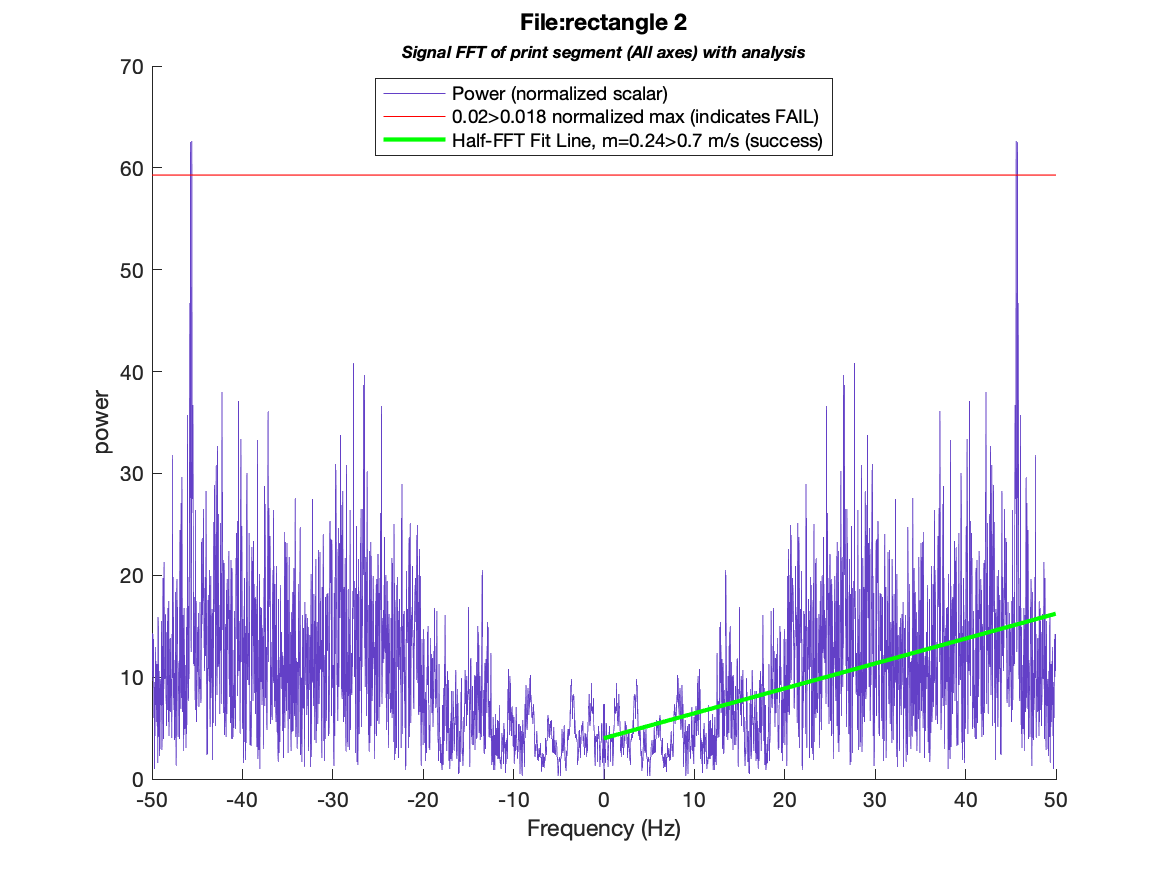
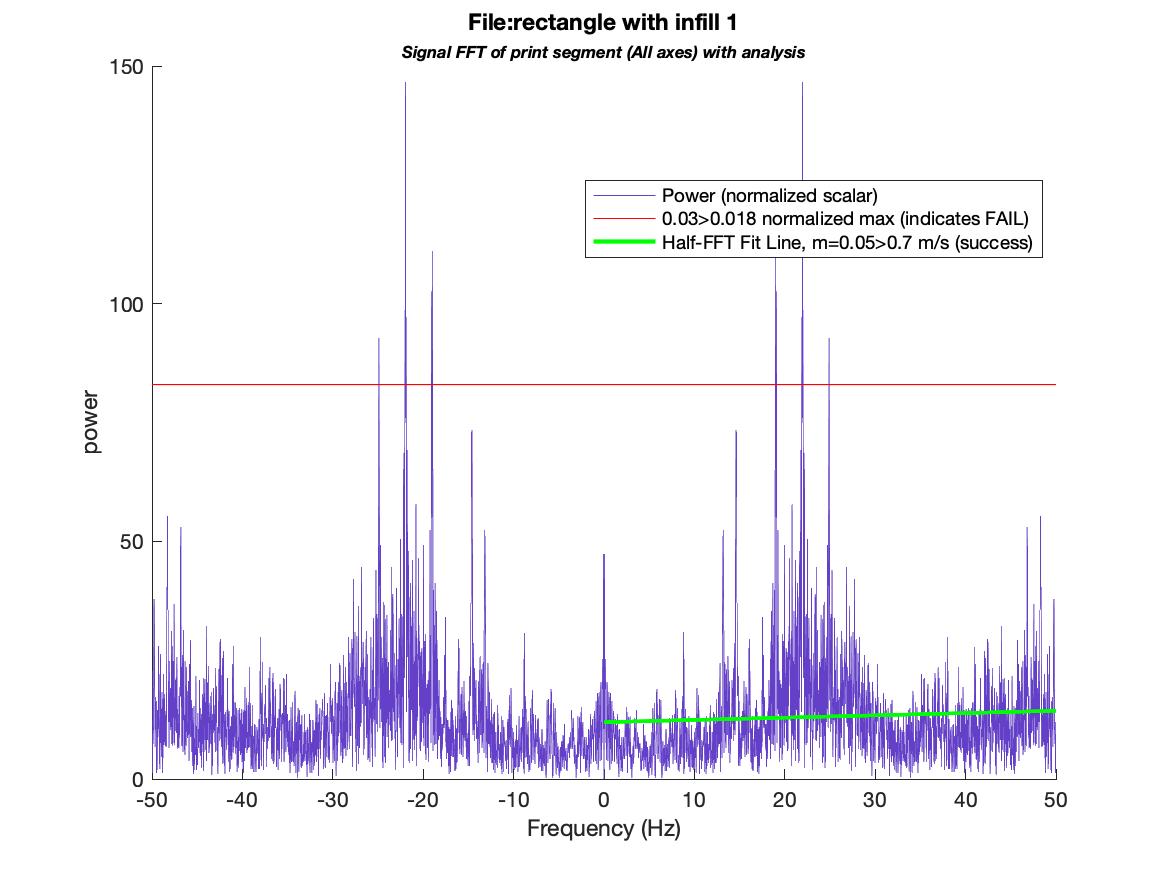
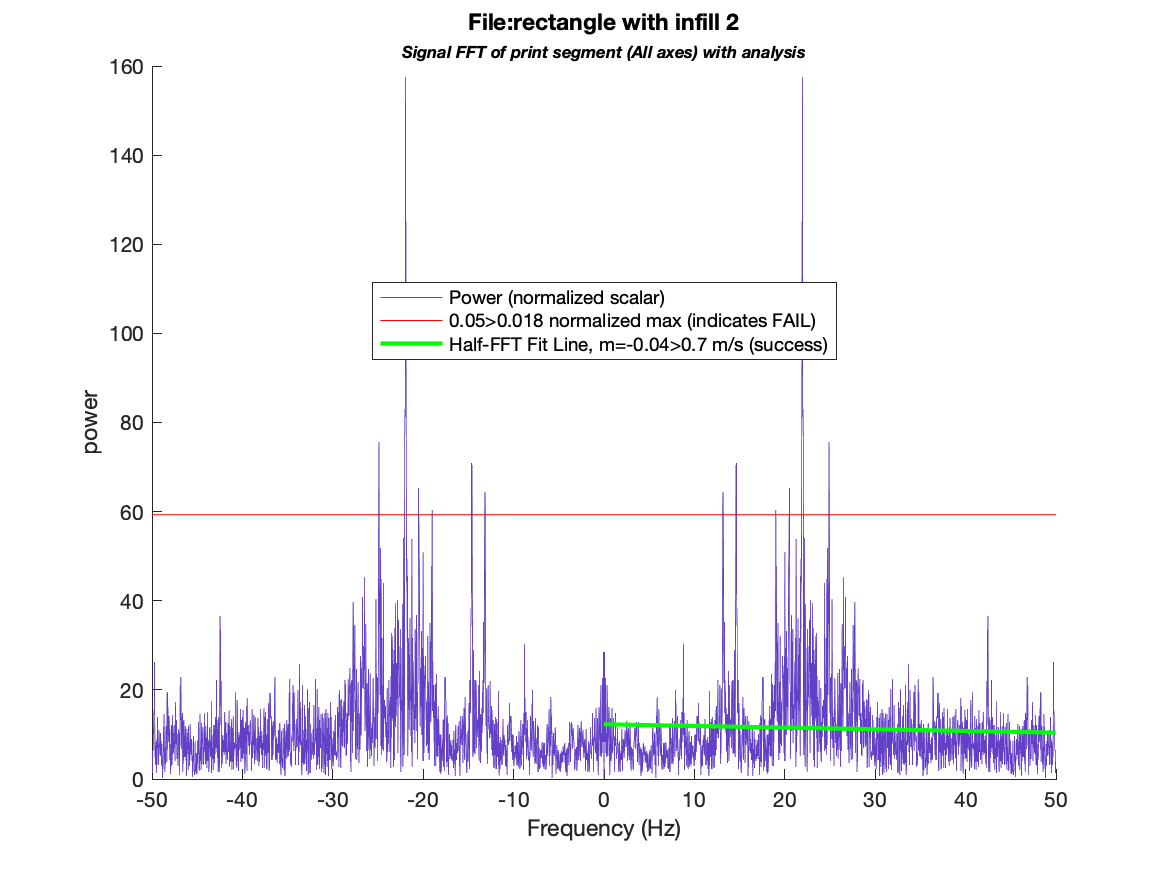
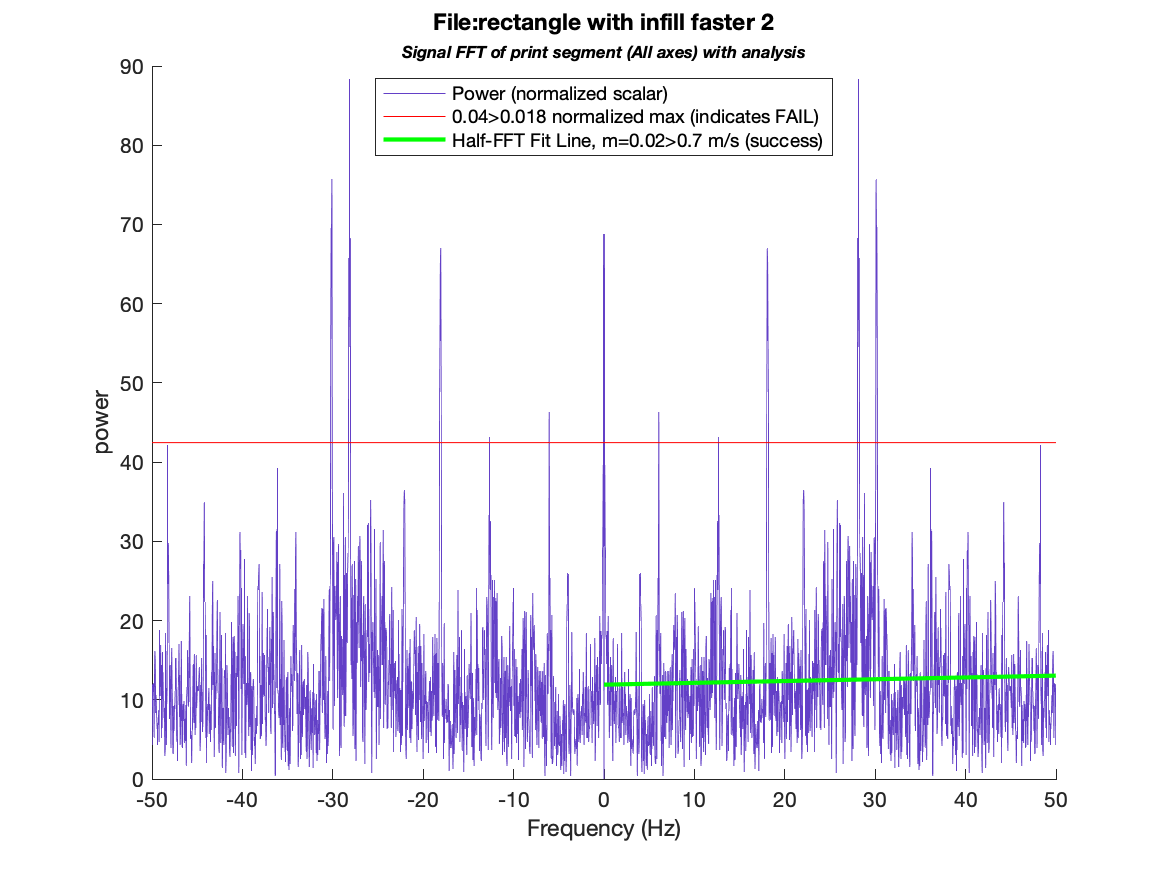
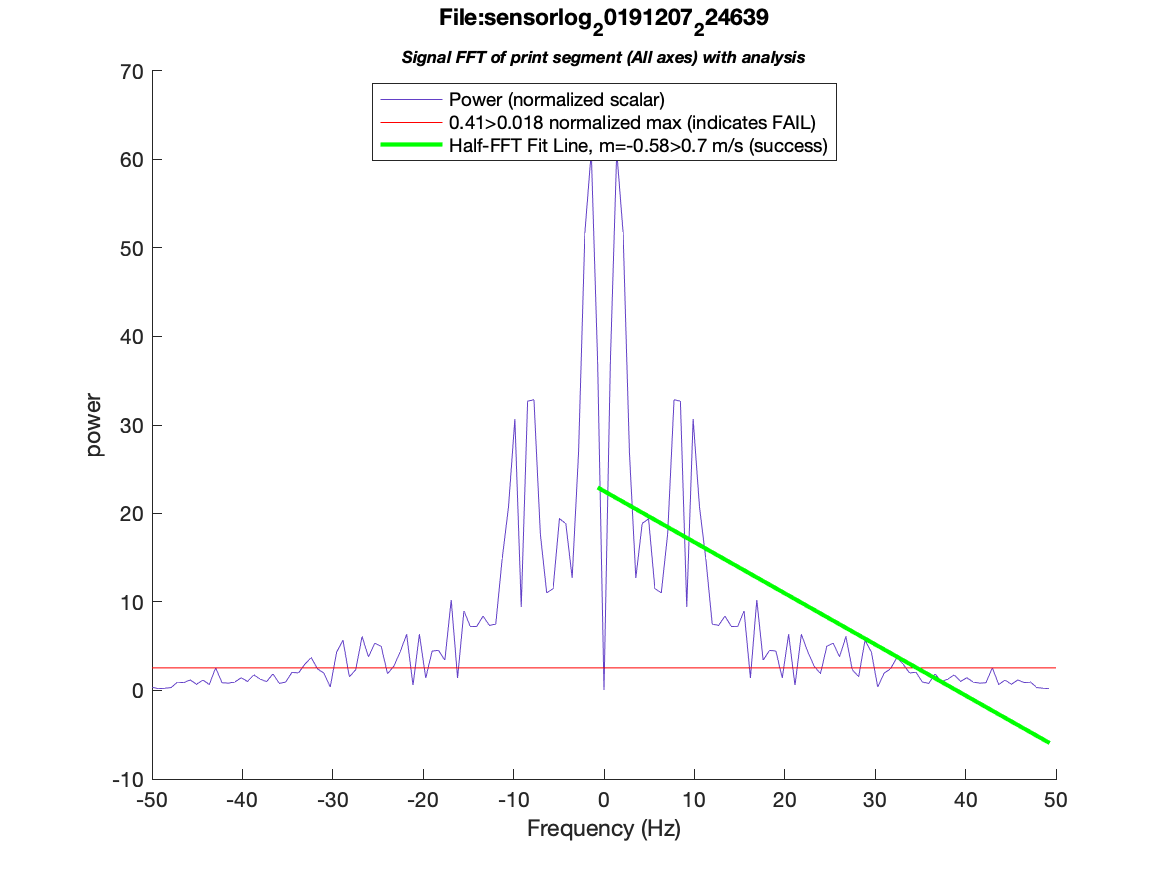
The following is a complete fourier regression analysis of our dataset, for reference. The green lines represent regressions which classify as successes, and the red lines represent regressions which classify as failures.