~PrintNoser~
Introducing the PrintNoser
The printnoser quickly and accurately diagnoses your 3D prints and removes the need to constantly baby 3D prints. In the past, it was often necessary or tempting to run between your office and your print area, but now you can monitor from afar! Better yet, the PrintNoser algorithm can diagnose print failures and notify you, so you don't need to deal with cumbersome video feeds.
Purpose
We sought to evaluate the effectiveness of medium-frequency print head acceleration measurements as a diagnostic tool for identifying and alerting print farm managers and makerspace employees of 3D print failures.
Anyone who uses 3D printers on a regular basis could benefit from the introduction of this tool into their printing process. In particular, anyone who is responsible for managing a large number of printers, or who services and maintains 3D printers as a small portion of their overall duties. People working in libraries or maker spaces are often in the position of needing to take care of many 3D printers, or many different types of machines at once. Additionally, in these situations many different people, some of whom not very familiar with the process, use such publicly available devices to manufacture parts. This can lead to reduced printer reliability, which we aim to fix.
How it works
Our tool is based on data from an accelerometer mounted on the print head of a 3D printer. Modular and uninstrusive, it can be mounted and calibrated on any printer, removing the barriers of expensive tooling that makerspaces and students cannot afford.
Read the GCODE files we wrote for testing
Check out some more of the math, programming, and context behind it
Check out the source code for even more details: https://github.com/inkering/printnoser
The mount
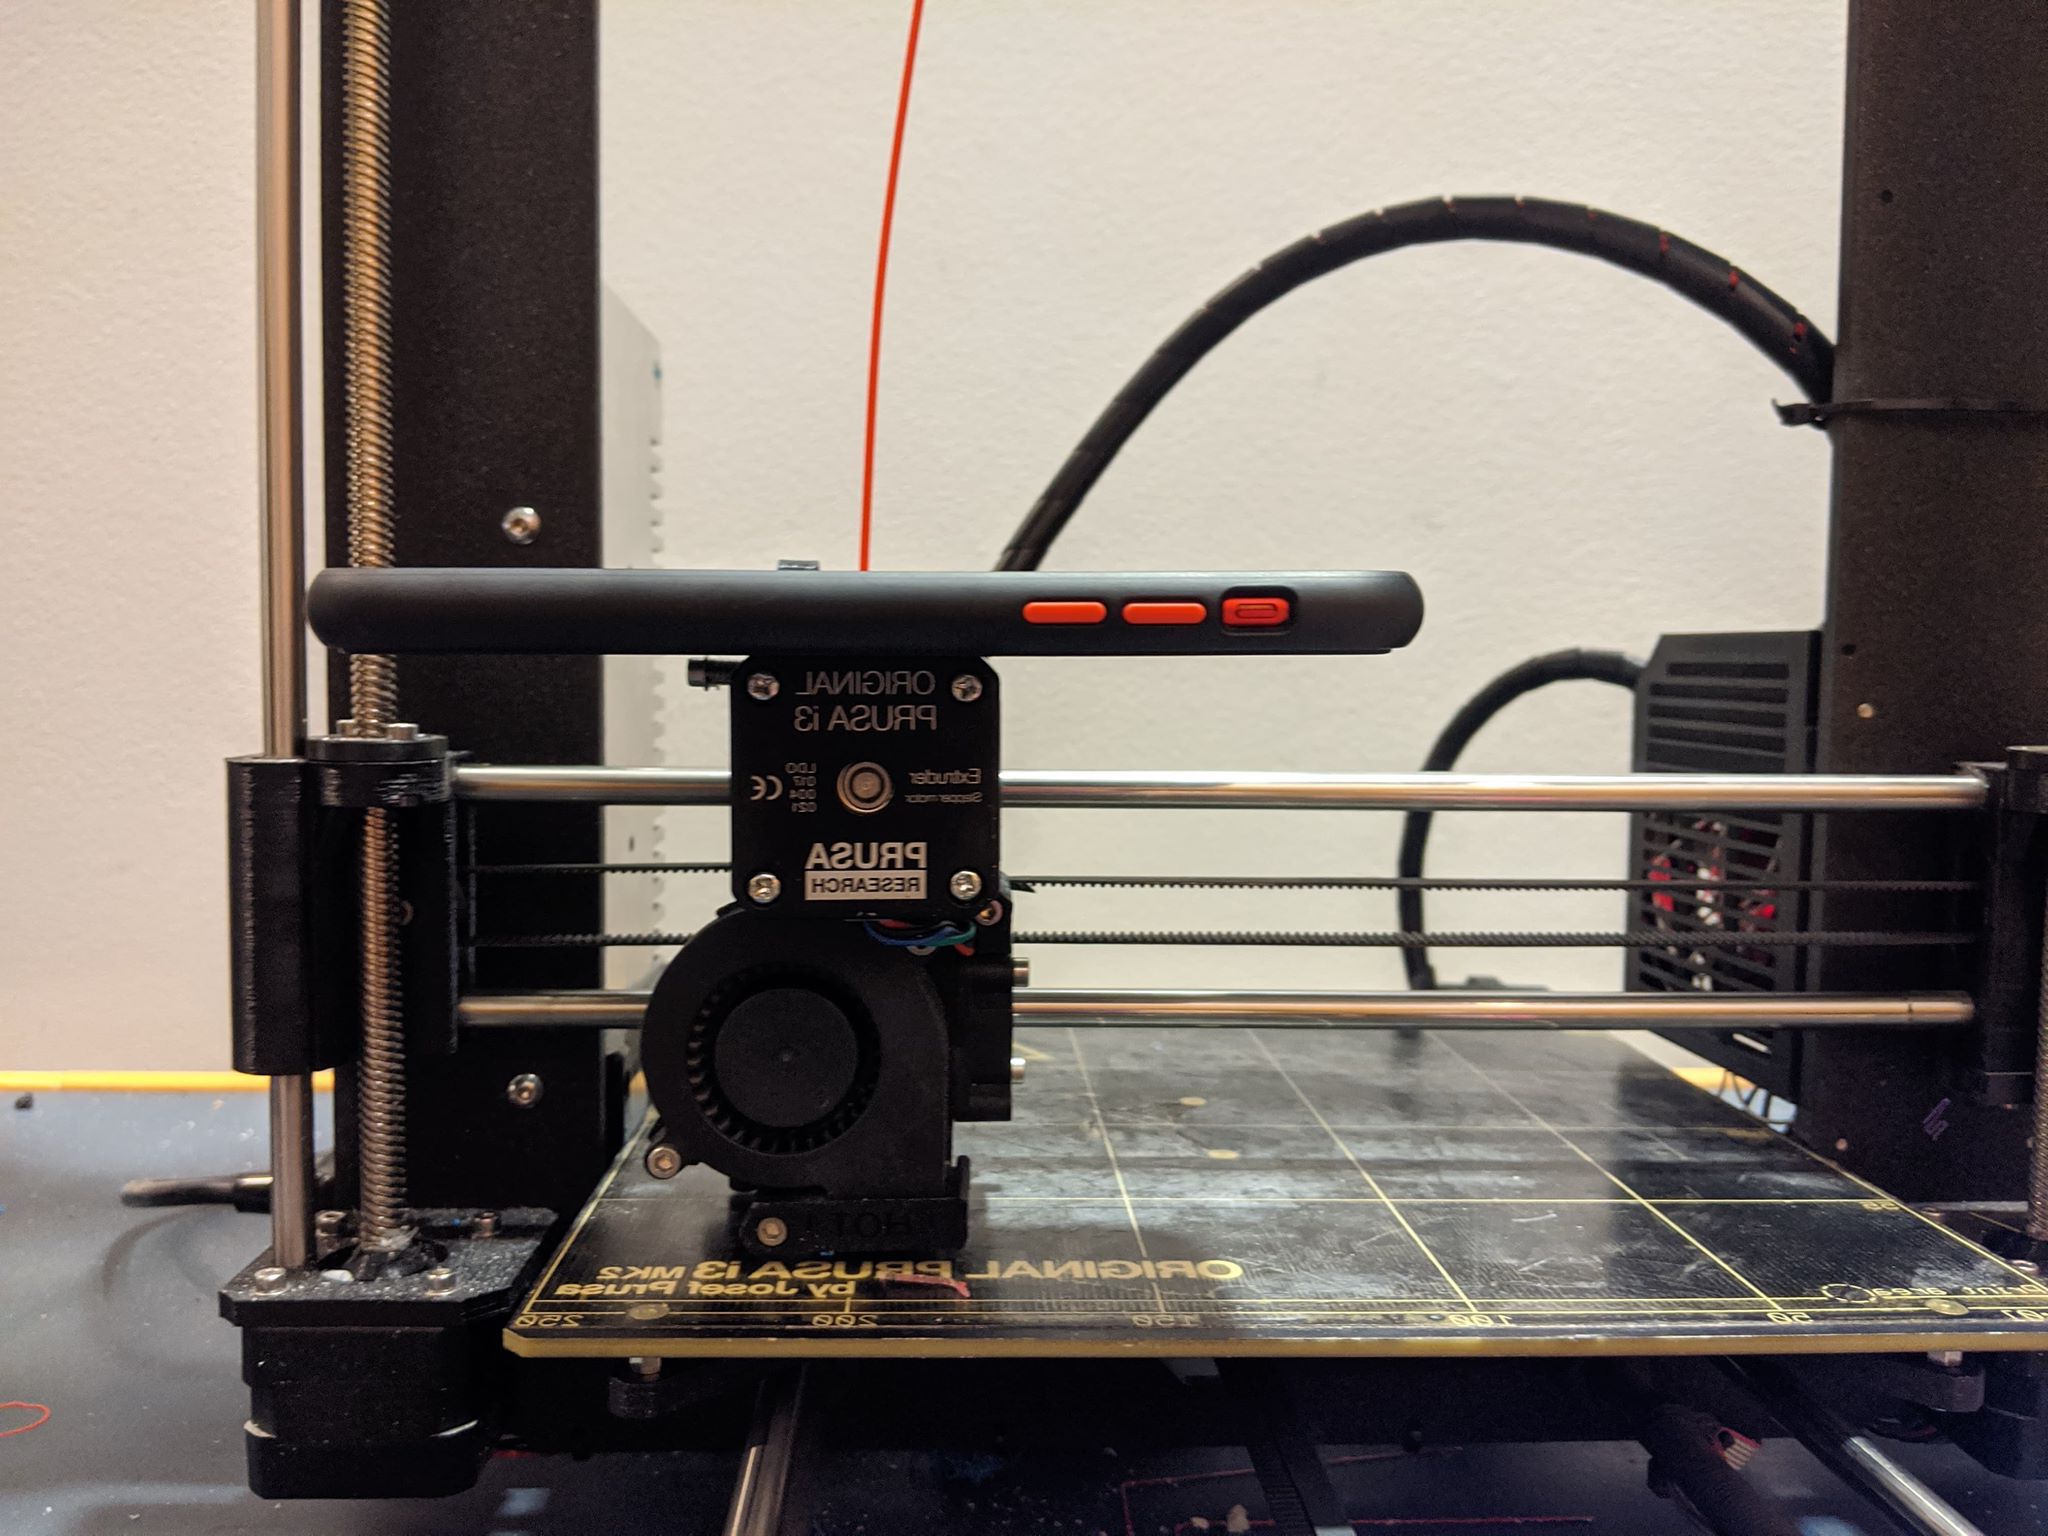
Figure 1: Our prototype experimental setup, featuring a smart phone and a prusa printer
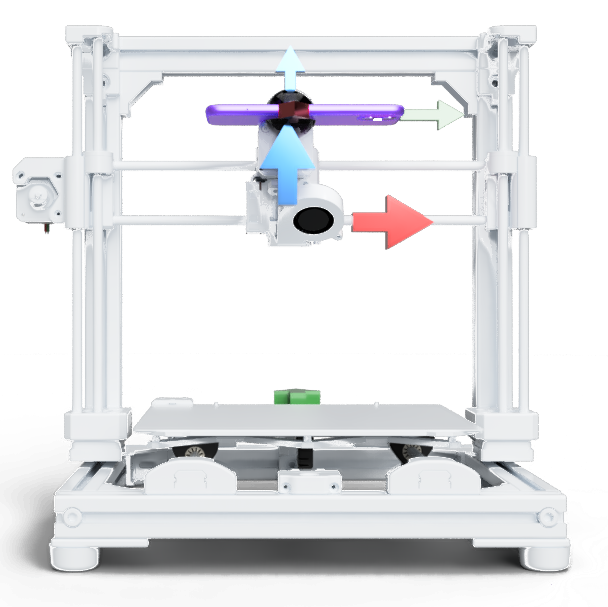
Figure 2: A front view of the axes of our system
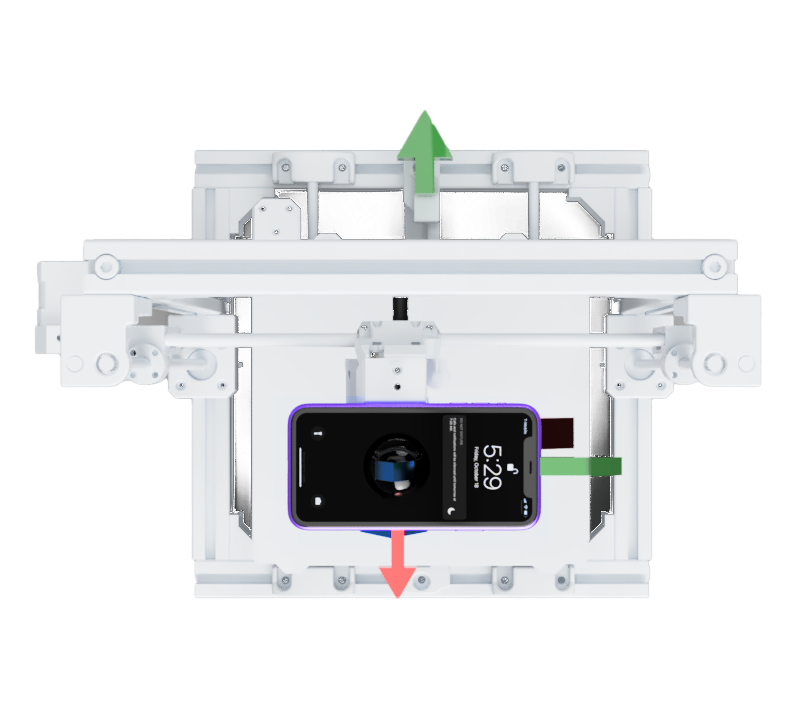
Figure 3: top view of the axes of our system
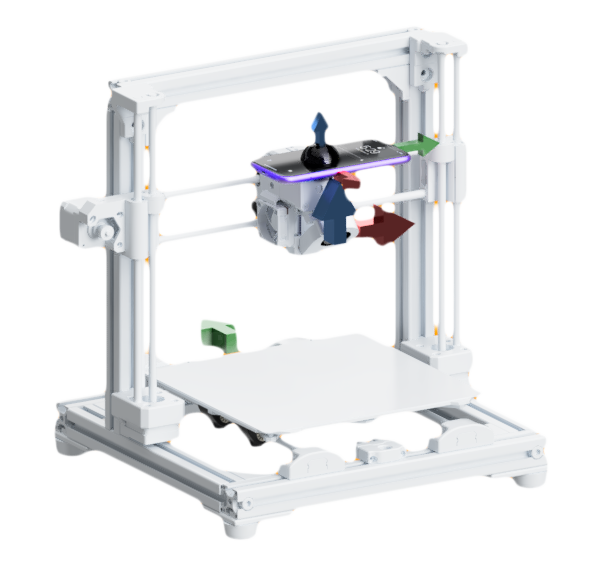
Figure 4: top view of the axes of our system
For figures 2 through 4, green represents the y-axis, red represents the x-axis, and blue represents the z-axis. The smaller arrows indicate the coordinate system of the phone, and the larger arrows indicate the coordinate system of the 3D printer control system. We chose coordinate systems with a shared origin so all our analysis can treat position/acceleration changes in the phone system to be interchangeable with position/acceleration changes in the ground system or the 3D printer system.
Outputs
Threshold Analysis Algorithm
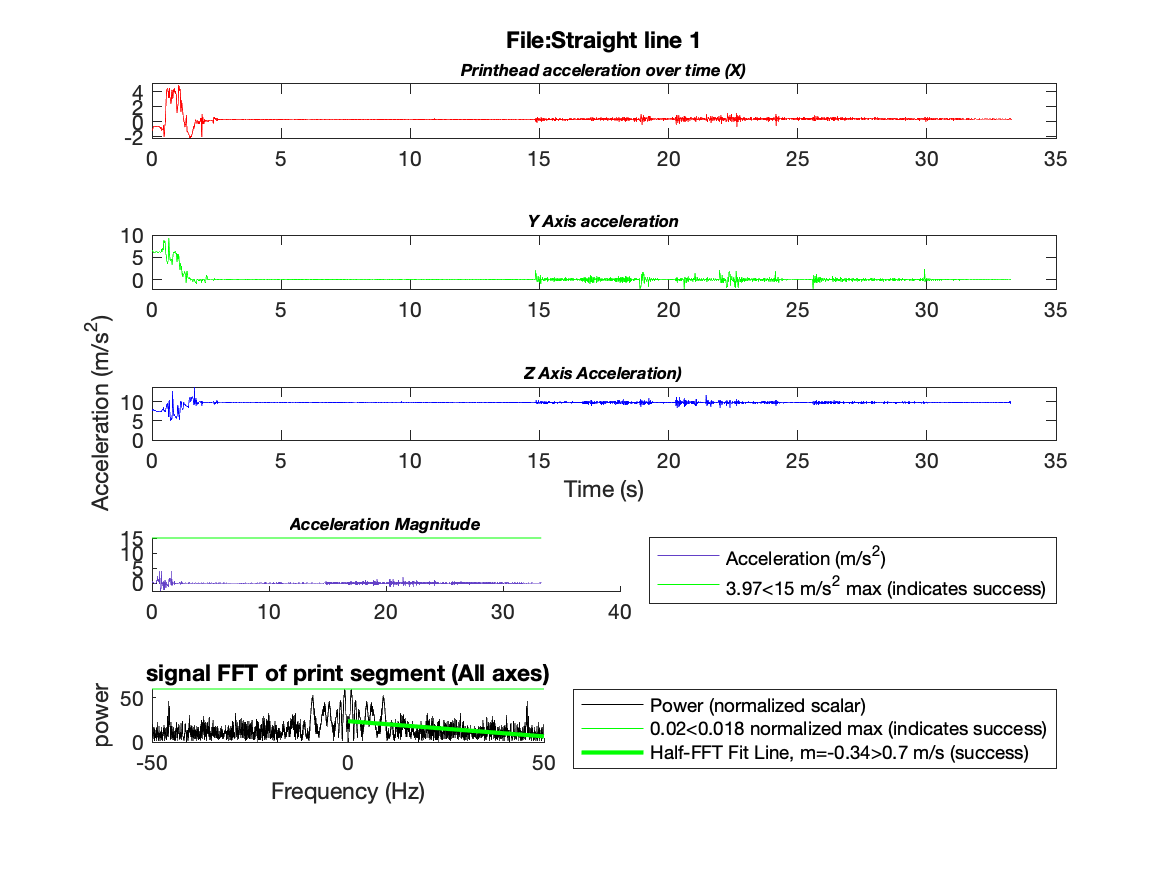
Figure 5: A successful print of a line
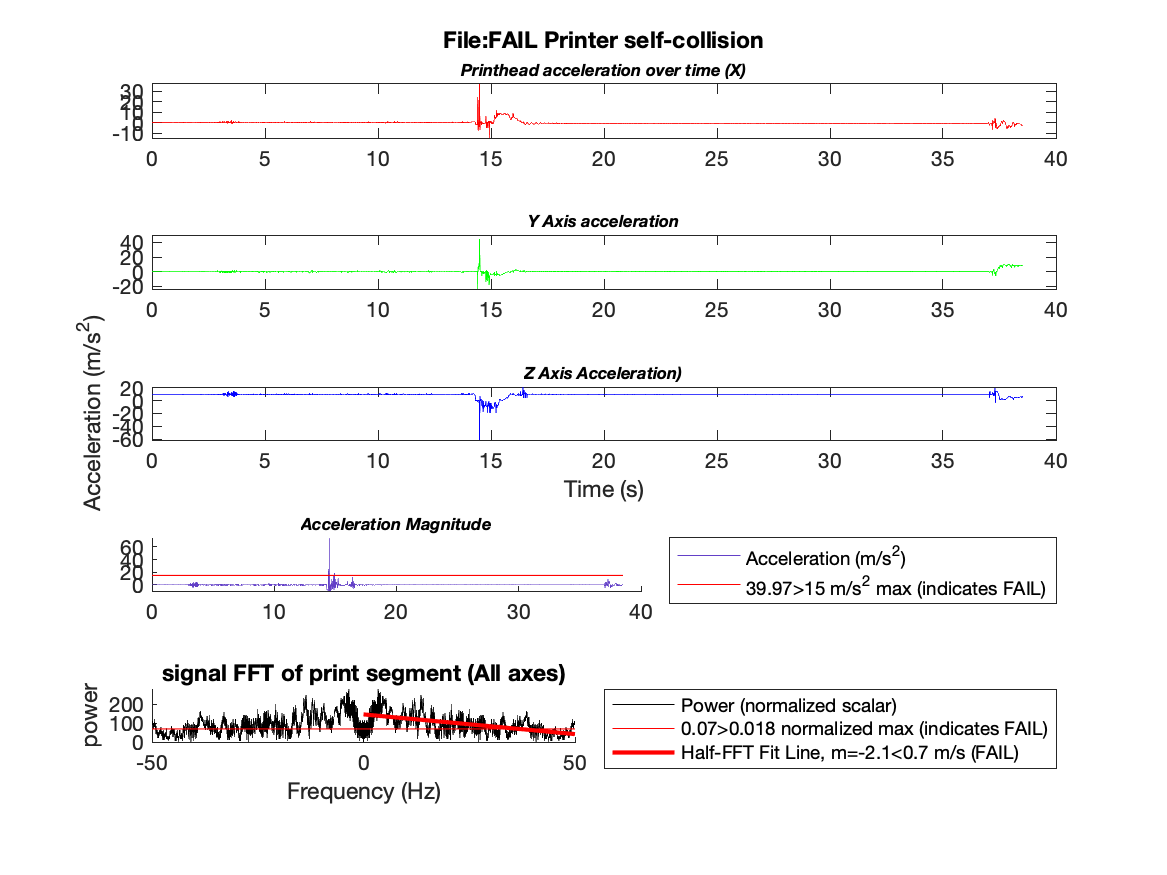
Figure 6: A failed print of a rectangle
For our first method of analysis, we developed a tunable layer of thresholding on the measured acceleration signal. This type of failure detection is broad, but works well for jerky or catastrophic failures. In figure 5 we correctly determined a successful print and in figure 6 we detect a failed print situation due to a significant irregularity in the signal.
Unfortunately, this method breaks down for more complex failure types. It relies on the type of failure exerting a force greater than gravity for several measurements. We eliminate false measurements in this technique by taking several max reading samples and averaging them.
An appendix of our analyzed fourier plot data is available here (fair warning, lots of data!)
FFT Threshold Algorithm
This method did not work effectively. We expected to be able to measure the maximum amplitude of the low-frequency ranges to detect catastrophic print failures. In our failure analysis, we found that high amplitude does not equate consistently to a failure mode — even when it occurs in the low-frequency ranges. Narrowing to specific frequency ranges as a method of filtering also does not work well, because after a large amplitude failure, the print head often experiences some sort of higher frequency oscillation, which can shift the time-domain signal that corresponds to a failure up and down the frequency-power domain spectrum depending on the error.
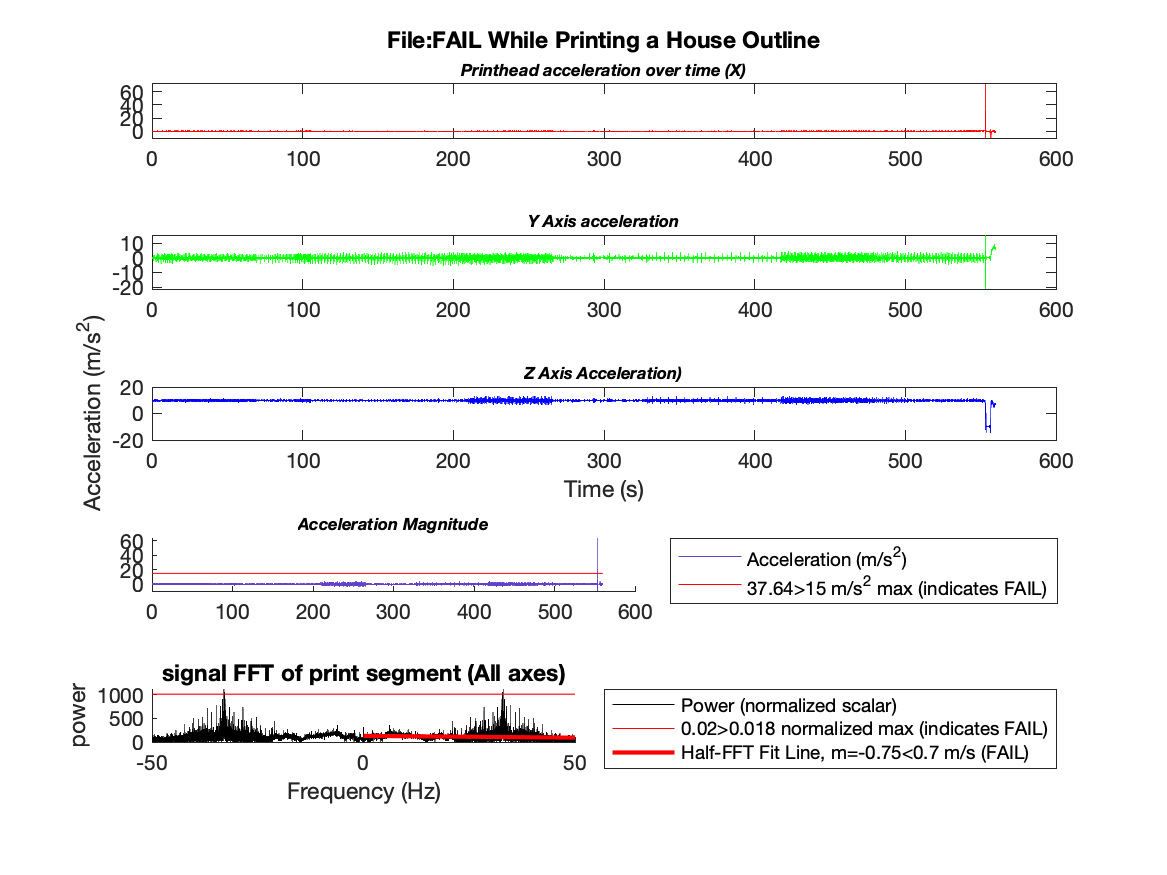
Figure 7: A failed print of a house shape
In Figure 7, this phenomena is shown in the signal FFT plot. Particularly, where the FFT output spikes around the 30 Hz range. Rather than providing a clear and predicable low frequency spike, the FFT analysis output is both noisey and, relative to the system, high frequency. Note that this method is sometimes able to correctly diagnose failed prints, such as in this Figure, but only when the print includes virtually no other noise.
Linear Regression Algorithm
Our next attempt was to perform a linear regression process on the output of the FFT in order to look at trends in the shape of the data. Our hypothesis was that successful prints would be weighted towards higher frequency data and failed prints would be weighted towards lower frequencies. As a result, the slope of the regression should determine the status of the print. Potentially, it can even be implemented to calculate ongoing regression lines as the print runs.
We use a simple threshold on the slope of the linear regression line to determine whether the print has failed or not. Using this method, we reached a 100% success rate among n = 18 samples, with zero false positives and zero false negatives. Going forward, more testing is needed to confirm that the algorithm can successfully diagnose more complex print failures and handle noisier situations like printing support material at high speed. Already, the algorithm was able to reliably recognize our most extreme print test (printing a box with dense infill at 300mm/s travel speed) as a successful print task.
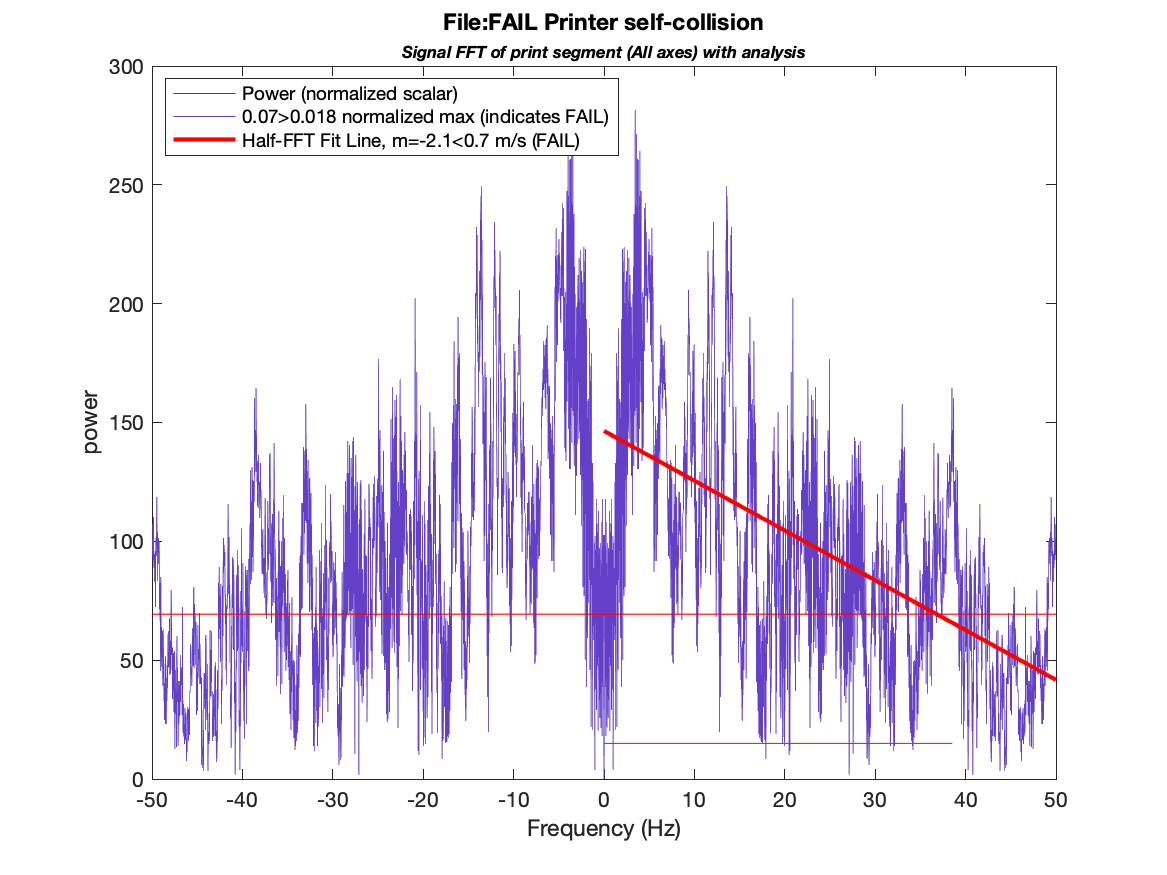
Figure 8: A failed print in which the printhead collided with an existing line on the bed.
In Figure 8, we see the FFT plot and overlaid analysis from a failed print. In this case, the print collided with a small piece of previously printed plastic, causing a measurable vibration and a complete print failure. In this case, the form of vibrations are relatively subtle, and in a similar case the first two methods we tried alone (acceleration threshold and FFT threshold) might be unable to detect this type of failure. In this case, we see that the margin of detection is particularly wide (~200%).
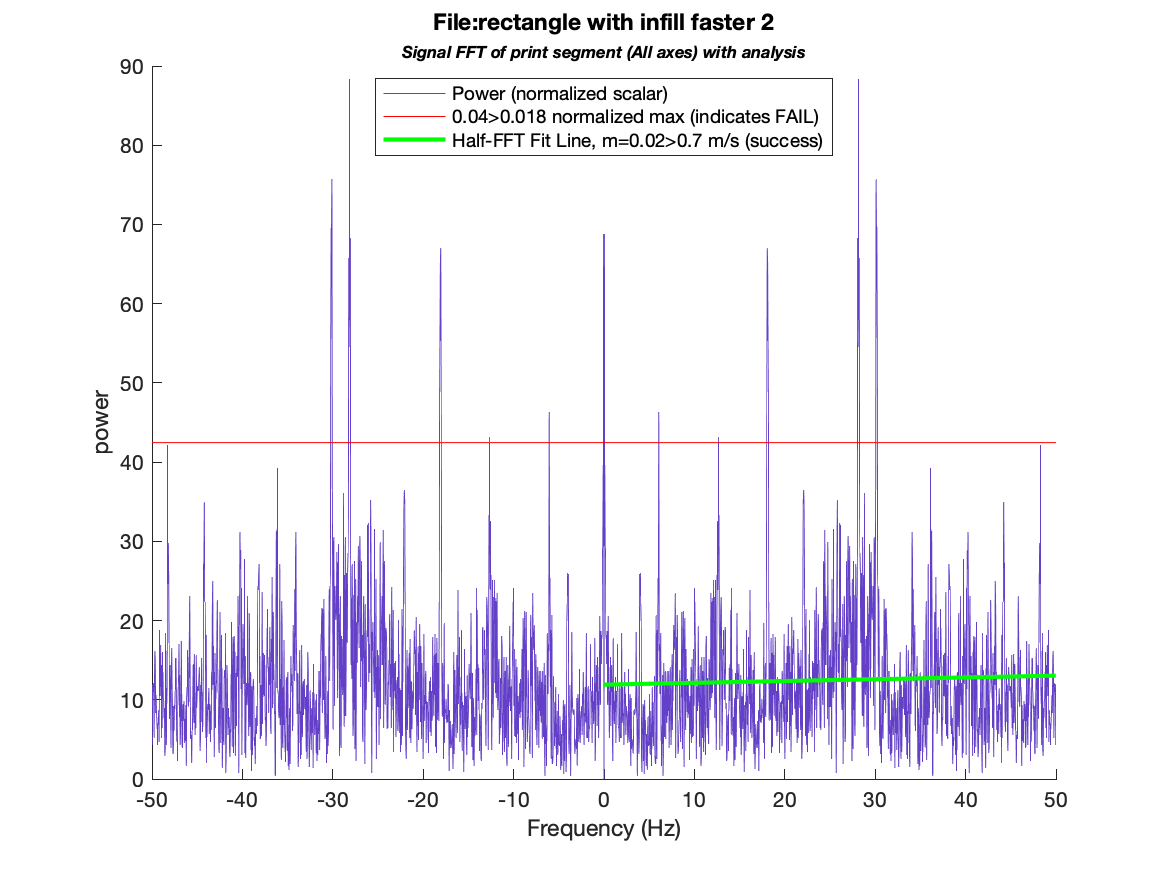
Figure 9: A succeeded print of a rectangle with infill going quickly.
In Figure 9, we see a successful print of a rectangle with infill. This print is notable because we hand-wrote a GCODE to perform this task at 300mm/s, which is extremely fast. It's generally unlikely that the acceleration values recorded at the corners of this rectangle would happen during typical printing usage. because some of the higher-power frequencies are within the low-mid range, our FFT threshold algorithm fails and considers this print a failure by a margin of >220%. However, since the unusual frequency oscillations are not strongly weighted toward the center of the plot, the linear regression fit method is able to correctly diagnose this dataset as a successful print.
An appendix of our analyzed data is available here (fair warning, lots of data!)
Conclusion
By exploring a number of different classification techniques, we determined that performing a linear regression on fourier acceleration data is a promising method for 3D print analysis. In order to get there, we learned that falling back on simple thresholded classification isn't enough to get a good picture of how a 3D print went, and results in a number of incorrect classifications in our dataset.
Our final algorithm uses a weighted linear regression of the FFT of accelerometer data to predict whether data corresponds to a print fail or success. Of the 18 test datasets we have collected so far, the algorithm achieves a 100% success rate.
Made by


What's Next
The next steps of this project will be to improve the user experience and software integration of our tool. Additionally, we will work to increase the number of different failure modes which we can detect, including being able to detect potential gradual decreases in print quality such as miniscule stepper failures.